
Practical engineering guidance
Microsoft Sentinel detection engineering: from KQL query to production rule
A KQL query becomes a reliable SOC detection only after its data, timing, entities, grouping, false positives and operational health have been tested.
Series: Security hardening
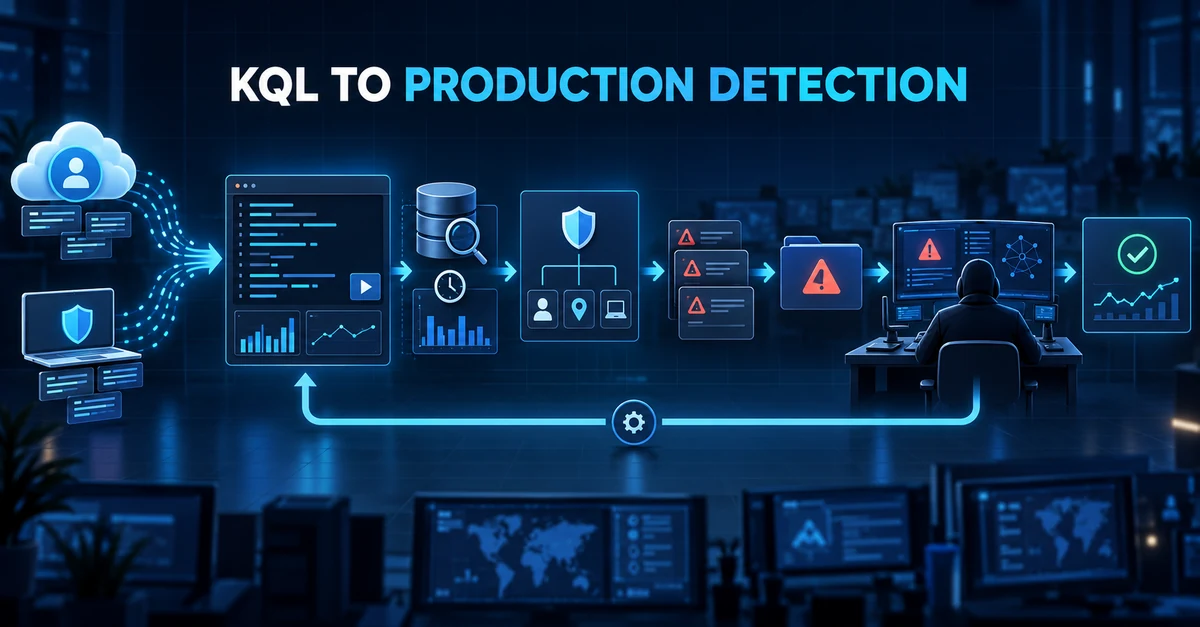
A useful KQL query is not yet a production detection. It becomes one only after the SOC has proved that the required data arrives, understood normal activity, chosen the correct time windows, mapped the entities an analyst needs, controlled alert volume and confirmed that the rule itself keeps running.
This distinction matters because a syntactically valid query can fail operationally in several ways. It can run against an empty table, miss late-arriving events, alert once for every row, create incidents with no useful entities, or stop running while everyone assumes it is still protecting the environment.
The objective is not to create the largest number of alerts. It is to create a repeatable detection that produces enough evidence for an analyst to make a decision.
Begin with a detection hypothesis
Write one sentence before opening the query editor:
If this behaviour occurs, these records should exist, these fields should identify the affected entity, and the result should justify analyst investigation.
For example:
If one source attempts to authenticate against many accounts within ten minutes, Entra sign-in records should show one IP address associated with an unusual number of distinct users and repeated failures.
That statement defines:
- the behaviour being detected;
- the required data source;
- the time window;
- the entity that connects the events;
- the reason an alert is useful.
Without this step, tuning normally becomes a sequence of exclusions added whenever somebody complains.
Confirm that the data exists
Do not design a rule around a connector that is installed but not delivering the required records. Confirm event volume and the latest event time for every table the detection uses.
union withsource=SourceTable isfuzzy=true
    SigninLogs,
    AuditLogs,
    SecurityEvent,
    DeviceProcessEvents
| where TimeGenerated > ago(24h)
| summarize
    Events = count(),
    LatestEvent = max(TimeGenerated)
    by SourceTable
| extend AgeMinutes = datetime_diff("minute", now(), LatestEvent)
| order by AgeMinutes desc
An empty result does not prove that nothing happened. It may mean the connector is absent, the table is not licensed, the relevant audit setting is disabled, or the data is delayed.
Also check coverage. One hundred reporting endpoints out of one hundred and twenty is not complete coverage, even if the table contains millions of events.
Measure ingestion delay
Scheduled rules look backwards over a defined period. If records arrive after that period has passed, the rule can miss them even though they eventually appear in the workspace.
Where a table contains both event and ingestion timestamps, measure the difference:
SigninLogs
| where TimeGenerated > ago(7d)
| extend IngestionDelayMinutes = datetime_diff(
    "minute",
    ingestion_time(),
    TimeGenerated
)
| summarize
    P50 = percentile(IngestionDelayMinutes, 50),
    P95 = percentile(IngestionDelayMinutes, 95),
    Maximum = max(IngestionDelayMinutes)
Use the observed delay when selecting the rule’s query frequency and lookup period. Microsoft Sentinel permits scheduled-rule frequency and lookback values from five minutes to fourteen days. The frequency must not exceed the lookback period. Overlapping windows can create duplicate results, while windows that are too short create gaps.
Establish the normal baseline
Run the candidate logic across a meaningful historical period before converting it into a rule. The period needs to include normal business cycles such as weekends, maintenance windows, month-end work and administrator activity.
SigninLogs
| where TimeGenerated > ago(30d)
| summarize
    Events = count(),
    Users = dcount(UserPrincipalName),
    SourceIPs = dcount(IPAddress)
    by AppDisplayName, bin(TimeGenerated, 1d)
| order by TimeGenerated asc
Look for:
- administrators and service accounts that dominate the results;
- scanners, proxies, gateways and automation platforms sharing an IP address;
- activity that occurs only during scheduled operations;
- fields that are regularly empty;
- sudden changes caused by connector or schema updates;
- whether the proposed threshold separates routine activity from investigation-worthy activity.
Exclude a legitimate entity only when its expected behaviour is understood. A broad exclusion for an administrator group or corporate address range can hide the same behaviour when an attacker uses it.
Build the query around the investigation
The output should contain the fields the analyst needs. A password-spray starting point could be:
let DetectionWindow = 10m;
let MinimumUsers = 10;
SigninLogs
| where TimeGenerated > ago(DetectionWindow)
| where ResultType != 0
| summarize
    FirstSeen = min(TimeGenerated),
    LastSeen = max(TimeGenerated),
    Attempts = count(),
    TargetedUsers = dcount(UserPrincipalName),
    Users = make_set(UserPrincipalName, 25),
    Applications = make_set(AppDisplayName, 10),
    ResultCodes = make_set(ResultType, 10)
    by IPAddress
| where TargetedUsers >= MinimumUsers
| project
    FirstSeen,
    LastSeen,
    IPAddress,
    Attempts,
    TargetedUsers,
    Users,
    Applications,
    ResultCodes
This is deliberately a starting point. Shared egress addresses, identity protection, named locations and known testing systems affect how it should be tuned. The rule must be evaluated in the environment where it will run.
Map entities deliberately
Entity mapping turns query fields into investigation objects such as Account, Host, IP, URL, Process, Mailbox and Azure Resource. Without it, the incident may contain an alert but provide no useful pivot into related activity.
For the example above, map IPAddress to the IP entity. If individual account records are needed
as entities, consider returning one row per meaningful account/IP combination rather than placing
all users inside one dynamic array.
Use custom details for investigation fields that do not represent entities—for example the number of targeted users, observed applications or result codes. Keep the alert title readable; do not try to put the complete query result into it.
Choose event and incident grouping separately
Event grouping determines whether one rule execution produces a single alert or an alert for each result. Incident grouping determines whether generated alerts are combined into incidents.
These settings have different operational consequences:
- One alert for all query results is suitable when the collection of events describes one behaviour.
- One alert per result is useful when every row represents an independently investigable entity.
- Grouping incidents by broad properties can combine unrelated attacks.
- No grouping can create dozens of duplicate incidents for one continuing condition.
Microsoft documents a maximum of 150 alerts from one scheduled-rule execution. If a rule configured for an alert per result returns more than that, the last generated alert summarises the remaining results. Test high-volume conditions before choosing this mode.
For a continuing behaviour, group on stable entities and rule identity for a limited period. Confirm that the grouping does not merge separate users, tenants or attack windows.
Pilot before enabling automation
A practical release sequence is:
- Run the query manually across historical data.
- Record the expected volume and representative results.
- Create the analytics rule without attaching remediation automation.
- Review every generated alert during the pilot.
- Classify results consistently as true positive, benign positive or false positive.
- Adjust logic, entity mapping, grouping and thresholds.
- Re-run the original test cases after each change.
- Attach automation only after alert behaviour is predictable.
Automation amplifies mistakes. A noisy detection connected immediately to account disablement, host isolation or ticket creation can turn a tuning problem into an outage or an unusable queue.
Validate the complete incident
Do not stop after the KQL query returns the expected row. Open the generated incident and check:
- the title makes sense without opening the query;
- severity matches the evidence;
- mapped entities are correct;
- custom details contain the investigation context;
- links and timestamps work;
- the grouping behaviour is understandable;
- the analyst can reach the original records;
- automation, if present, receives the expected fields.
Test both a positive and a negative case. A positive test proves the rule can fire. A negative test proves common legitimate behaviour does not fire it.
Monitor whether the rule keeps working
Microsoft Sentinel can send analytics-rule health and audit information to the SentinelHealth
and SentinelAudit tables after health monitoring is enabled. Microsoft recommends using the
_SentinelHealth() and _SentinelAudit() functions so queries remain compatible with schema
changes.
Find analytics-rule executions that failed:
_SentinelHealth()
| where SentinelResourceType == "Analytics Rule"
| where Status != "Success"
| summarize
    Failures = count(),
    LatestFailure = max(TimeGenerated)
    by SentinelResourceName, Status, Reason
| order by LatestFailure desc
Find analytics rules that were changed or deleted:
_SentinelAudit()
| where SentinelResourceType == "Analytics Rule"
| project
    TimeGenerated,
    SentinelResourceName,
    Description,
    Status,
    ExtendedProperties
| order by TimeGenerated desc
Field availability can change, so inspect the returned schema in your workspace before using these examples in another rule or workbook.
Health monitoring deserves its own alerting path. A failed detection rule should not rely solely on that same detection layer to announce that it failed.
Measure detection quality
Review each production rule using operational measures rather than the number of alerts it creates:
- alerts and incidents per week;
- percentage investigated;
- true-positive and false-positive classifications;
- repeated benign entities;
- average alerts per incident;
- time from source event to alert;
- time from alert to analyst decision;
- rule failures;
- data-source freshness and coverage;
- changes made to the rule and their measured effect.
Microsoft Sentinel includes rule insights and tuning recommendations, including information about alerts per incident, incident classifications and frequently appearing entities. Microsoft marks detection tuning as a preview capability, so treat recommendations as input for analyst review, not as an automatic decision to exclude an entity.
Keep the rule reproducible
Store the detection definition outside the portal with:
- the detection hypothesis;
- required tables and connectors;
- KQL query;
- scheduling and lookback settings;
- entity mappings;
- grouping configuration;
- expected alert volume;
- test cases;
- known false positives;
- owner and review date;
- rollback procedure;
- change history.
Microsoft Sentinel supports analytics-rule definitions as code. A portal edit without a reviewed record makes it difficult to explain why behaviour changed or restore the last known-good rule.
Production checklist
Before enabling a rule, confirm:
- The detection hypothesis is written.
- Required tables are receiving current data.
- Asset and user coverage is known.
- Ingestion delay has been measured.
- The query has been run across representative history.
- Thresholds and exclusions are supported by evidence.
- Account, host, IP and other entities are mapped correctly.
- Custom details help the analyst investigate.
- Event grouping and incident grouping were tested.
- Positive and negative test cases passed.
- The full generated incident was reviewed.
- Automation is absent or separately approved during the pilot.
- Rule health and audit monitoring are enabled.
- The definition and rollback procedure are stored in source control.
Verification and limits
The scheduled-rule timing, entity mapping, event grouping, incident grouping, analytics health and audit behaviour described here were checked against Microsoft Learn on 5 October 2026. Detection tuning recommendations are documented as preview functionality. Microsoft also states that custom detections are now the preferred unified experience for creating new detections across Microsoft Sentinel and Microsoft Defender XDR; organisations should confirm the current portal and rule type for their environment before following interface-specific steps.
The KQL examples were reviewed for structure but were not executed against a production Sentinel workspace for this article. Table availability, field population and normal behaviour vary between tenants. Run every query manually, inspect its schema and measure its output before enabling an analytics rule.
References
Reader feedback
Was this article useful?
No ratings yet. Be the first to rate this article.